Use Cases
Explore real-world applications and scenarios where our data and insights drive meaningful outcomes for healthcare organizations, researchers, and decision-makers.
Case Study
About the Use Case
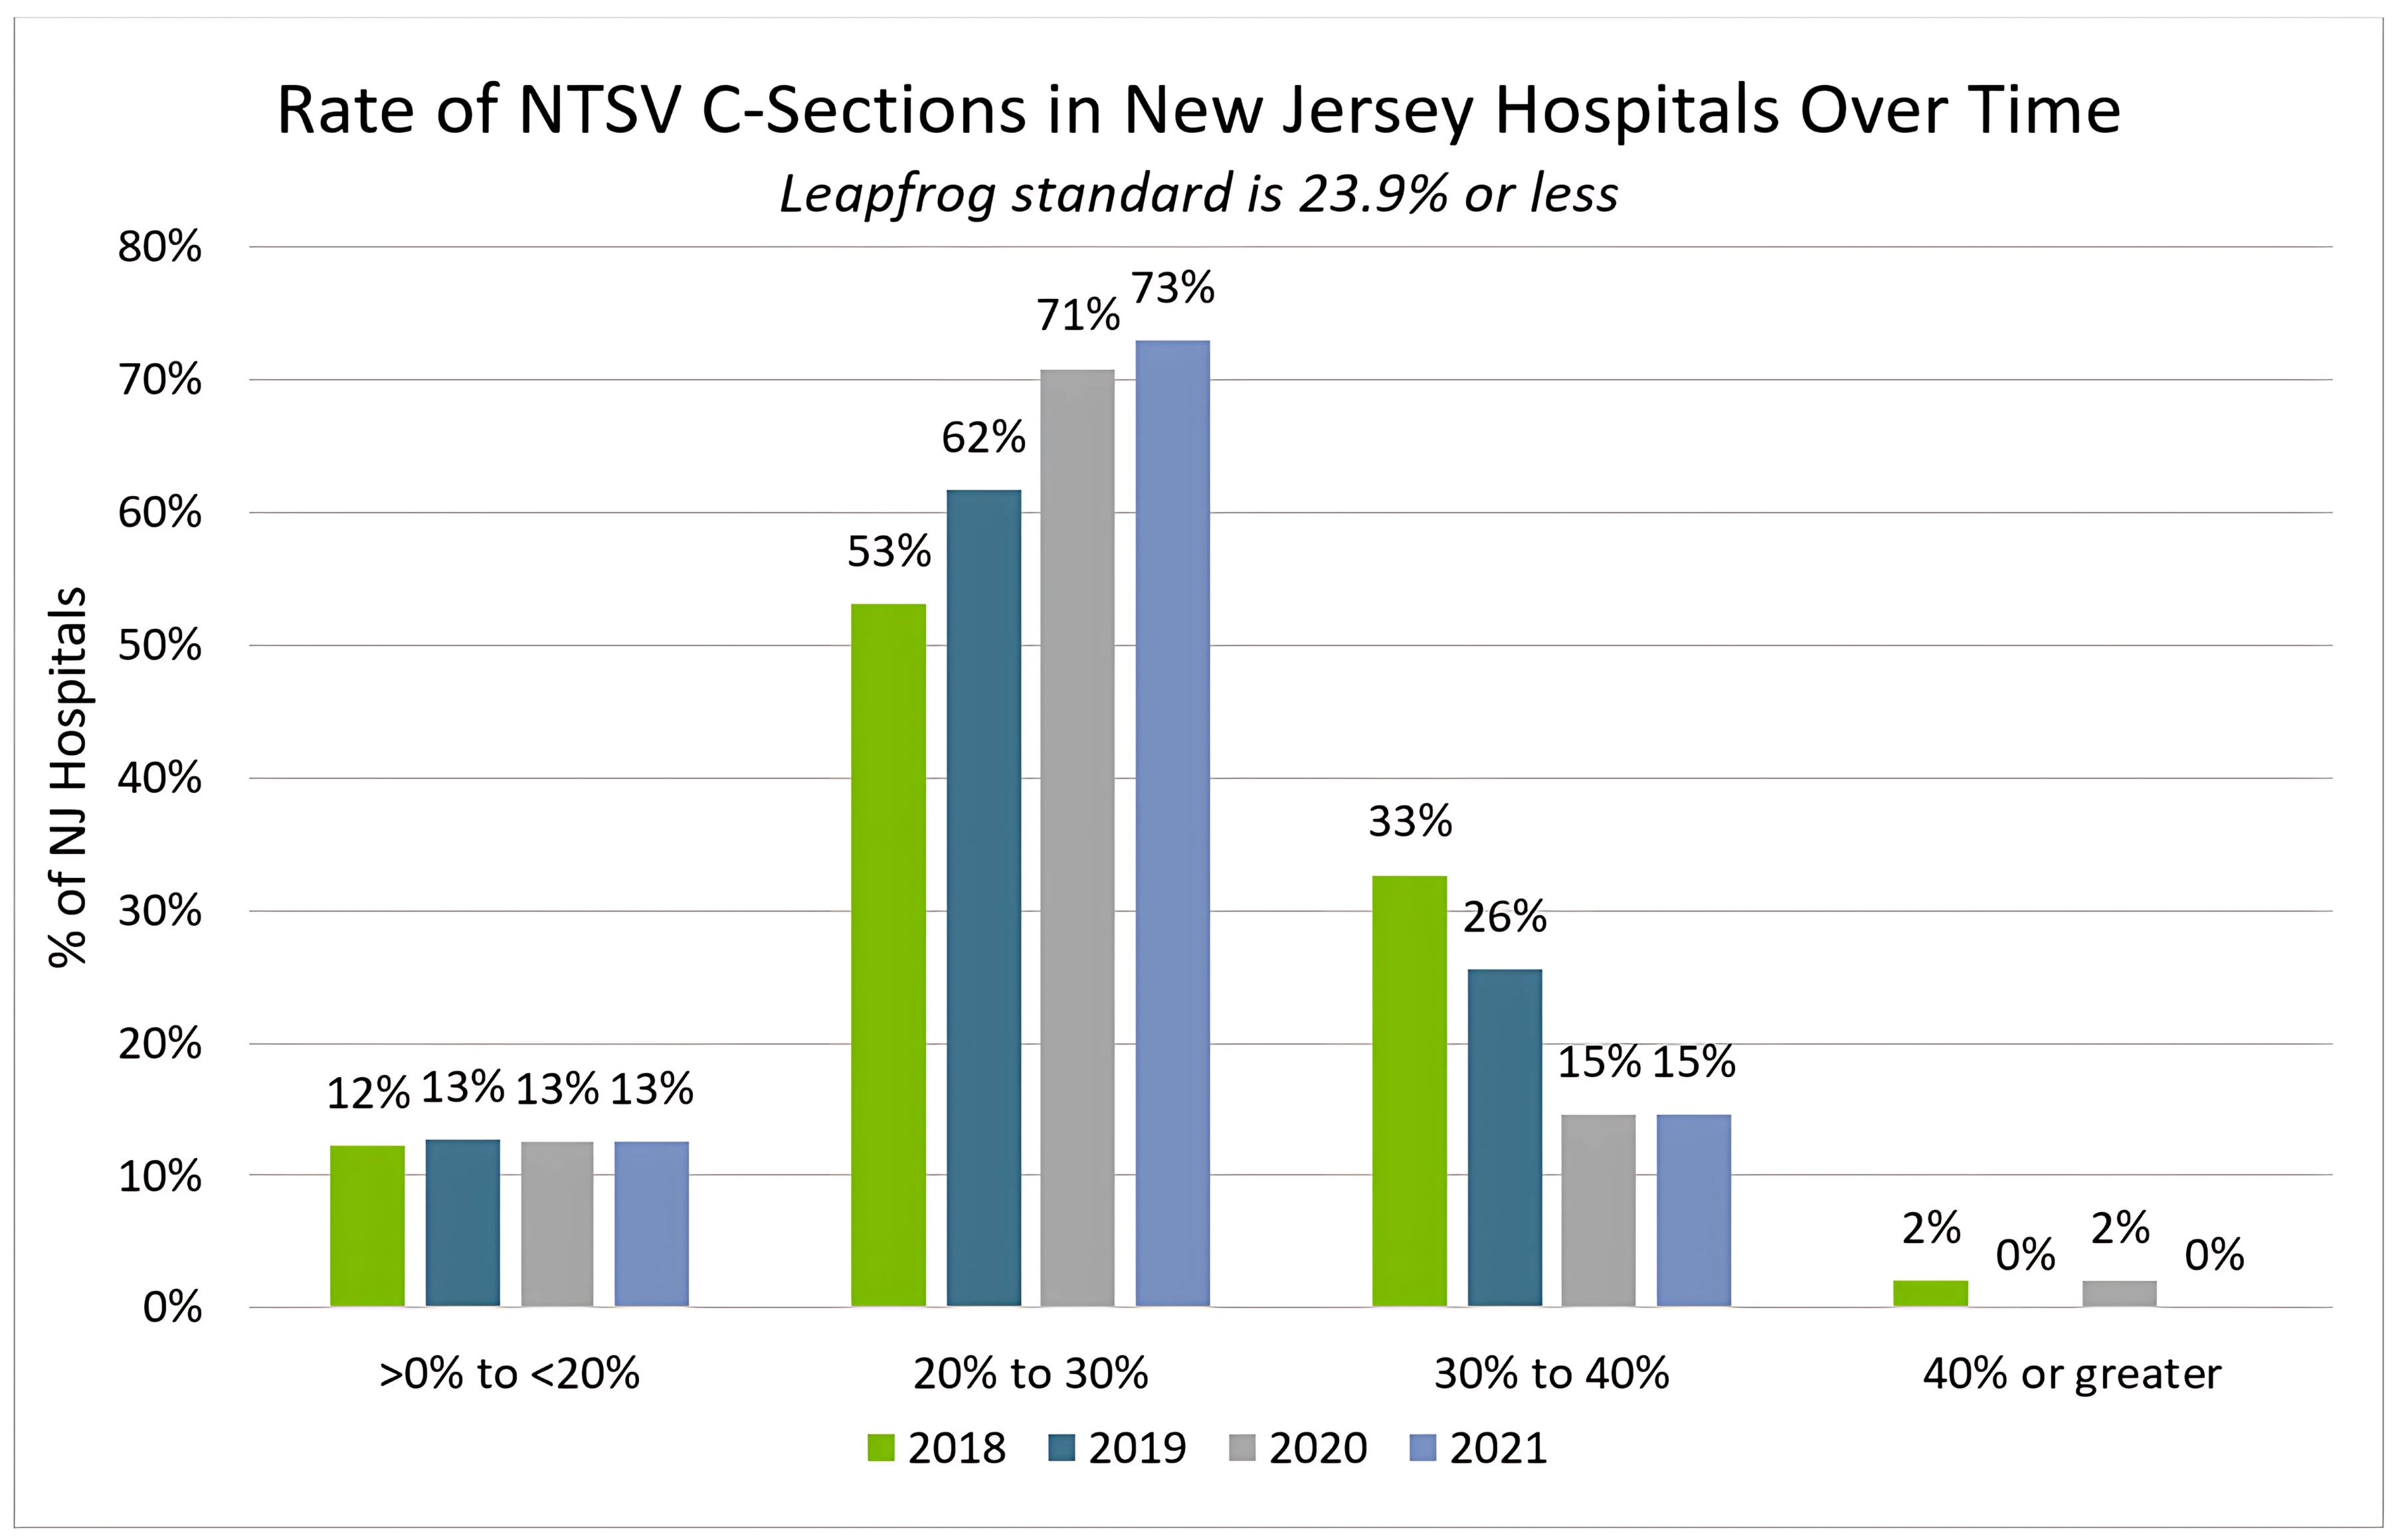
New Jersey hospitals had alarmingly high C-section rates, significantly above the national average, raising concerns about patient safety and unnecessary healthcare costs. Since 2006, Horizon BCBSNJ has partnered with Leapfrog, using the Leapfrog Hospital Survey data to benchmark and track hospital performance. This data was ultimately used to reduce C-section rates, and improve health outcomes across New Jersey.
Measure
- NTSV C-Section rates 2018-2021 from the Leapfrog Hospital Survey Data Set – Explore Leapfrog’s Hospital Survey Data Set
Objectives
- Reduce unnecessary C-section rates in New Jersey hospitals.
- Achieve 100% participation from New Jersey hospitals in completing the Survey.
Implementation
- By introducing financial incentives, Horizon BCBSNJ encouraged hospitals to improve their performance metrics, including C-section rates.
- Horizon BCBSNJ partnered with other stakeholders, including the New Jersey Health Care Quality Institute, to encourage hospitals to complete the Survey.
- Referencing Leapfrog reports, Horizon BCBSNJ organized conferences and educational sessions, including presentations from Leapfrog.
Outcome
- Significant Reduction in C-section Rates: In 2018, hospitals with a 40% C-section rate reduced it to 18%.
- Survey Participation: In 2019, Horizon BCBSNJ’s network achieved 100% participation in the Survey for the first time.
Case Study
About the Use Case
To evaluate how Leapfrog Hospital Safety Grade data can be applied in healthcare claims analysis, a retrospective study was conducted by a national consulting firm specializing in insurance, benefits, and risk. The study used a proprietary data warehouse covering 25,000 employees and 50,000 members. The goal was to understand the relationship between Hospital Safety Grades and patterns in healthcare utilization, cost, and outcomes.
Measure
- Safety Grades 2022-2023 from the Leapfrog Hospital Safety Grade Data Set – Explore Leapfrog’s Hospital Safety Grade Data Set
Objectives
- Demonstrate how Leapfrog Hospital Safety Grades can be integrated into claims analysis.
- Identify variation in readmission rates and cost by Safety Grade.
- Highlight opportunities for quality improvement and spend optimization.
Implementation
- Analyzed incurred claims from July 1, 2022, to June 30, 2023.
- Mapped Leapfrog Safety Grades to provider claims using National Provider Identifiers (NPIs) in Excel.
- Evaluated readmission rates, average admission costs, and concentration of spend by Hospital Safety Grade.
Outcome
- 10% of graded claims account for 50% of spend.
- 37% of graded claims (~1K admissions) were paid at facilities Leapfrog rated C or D.
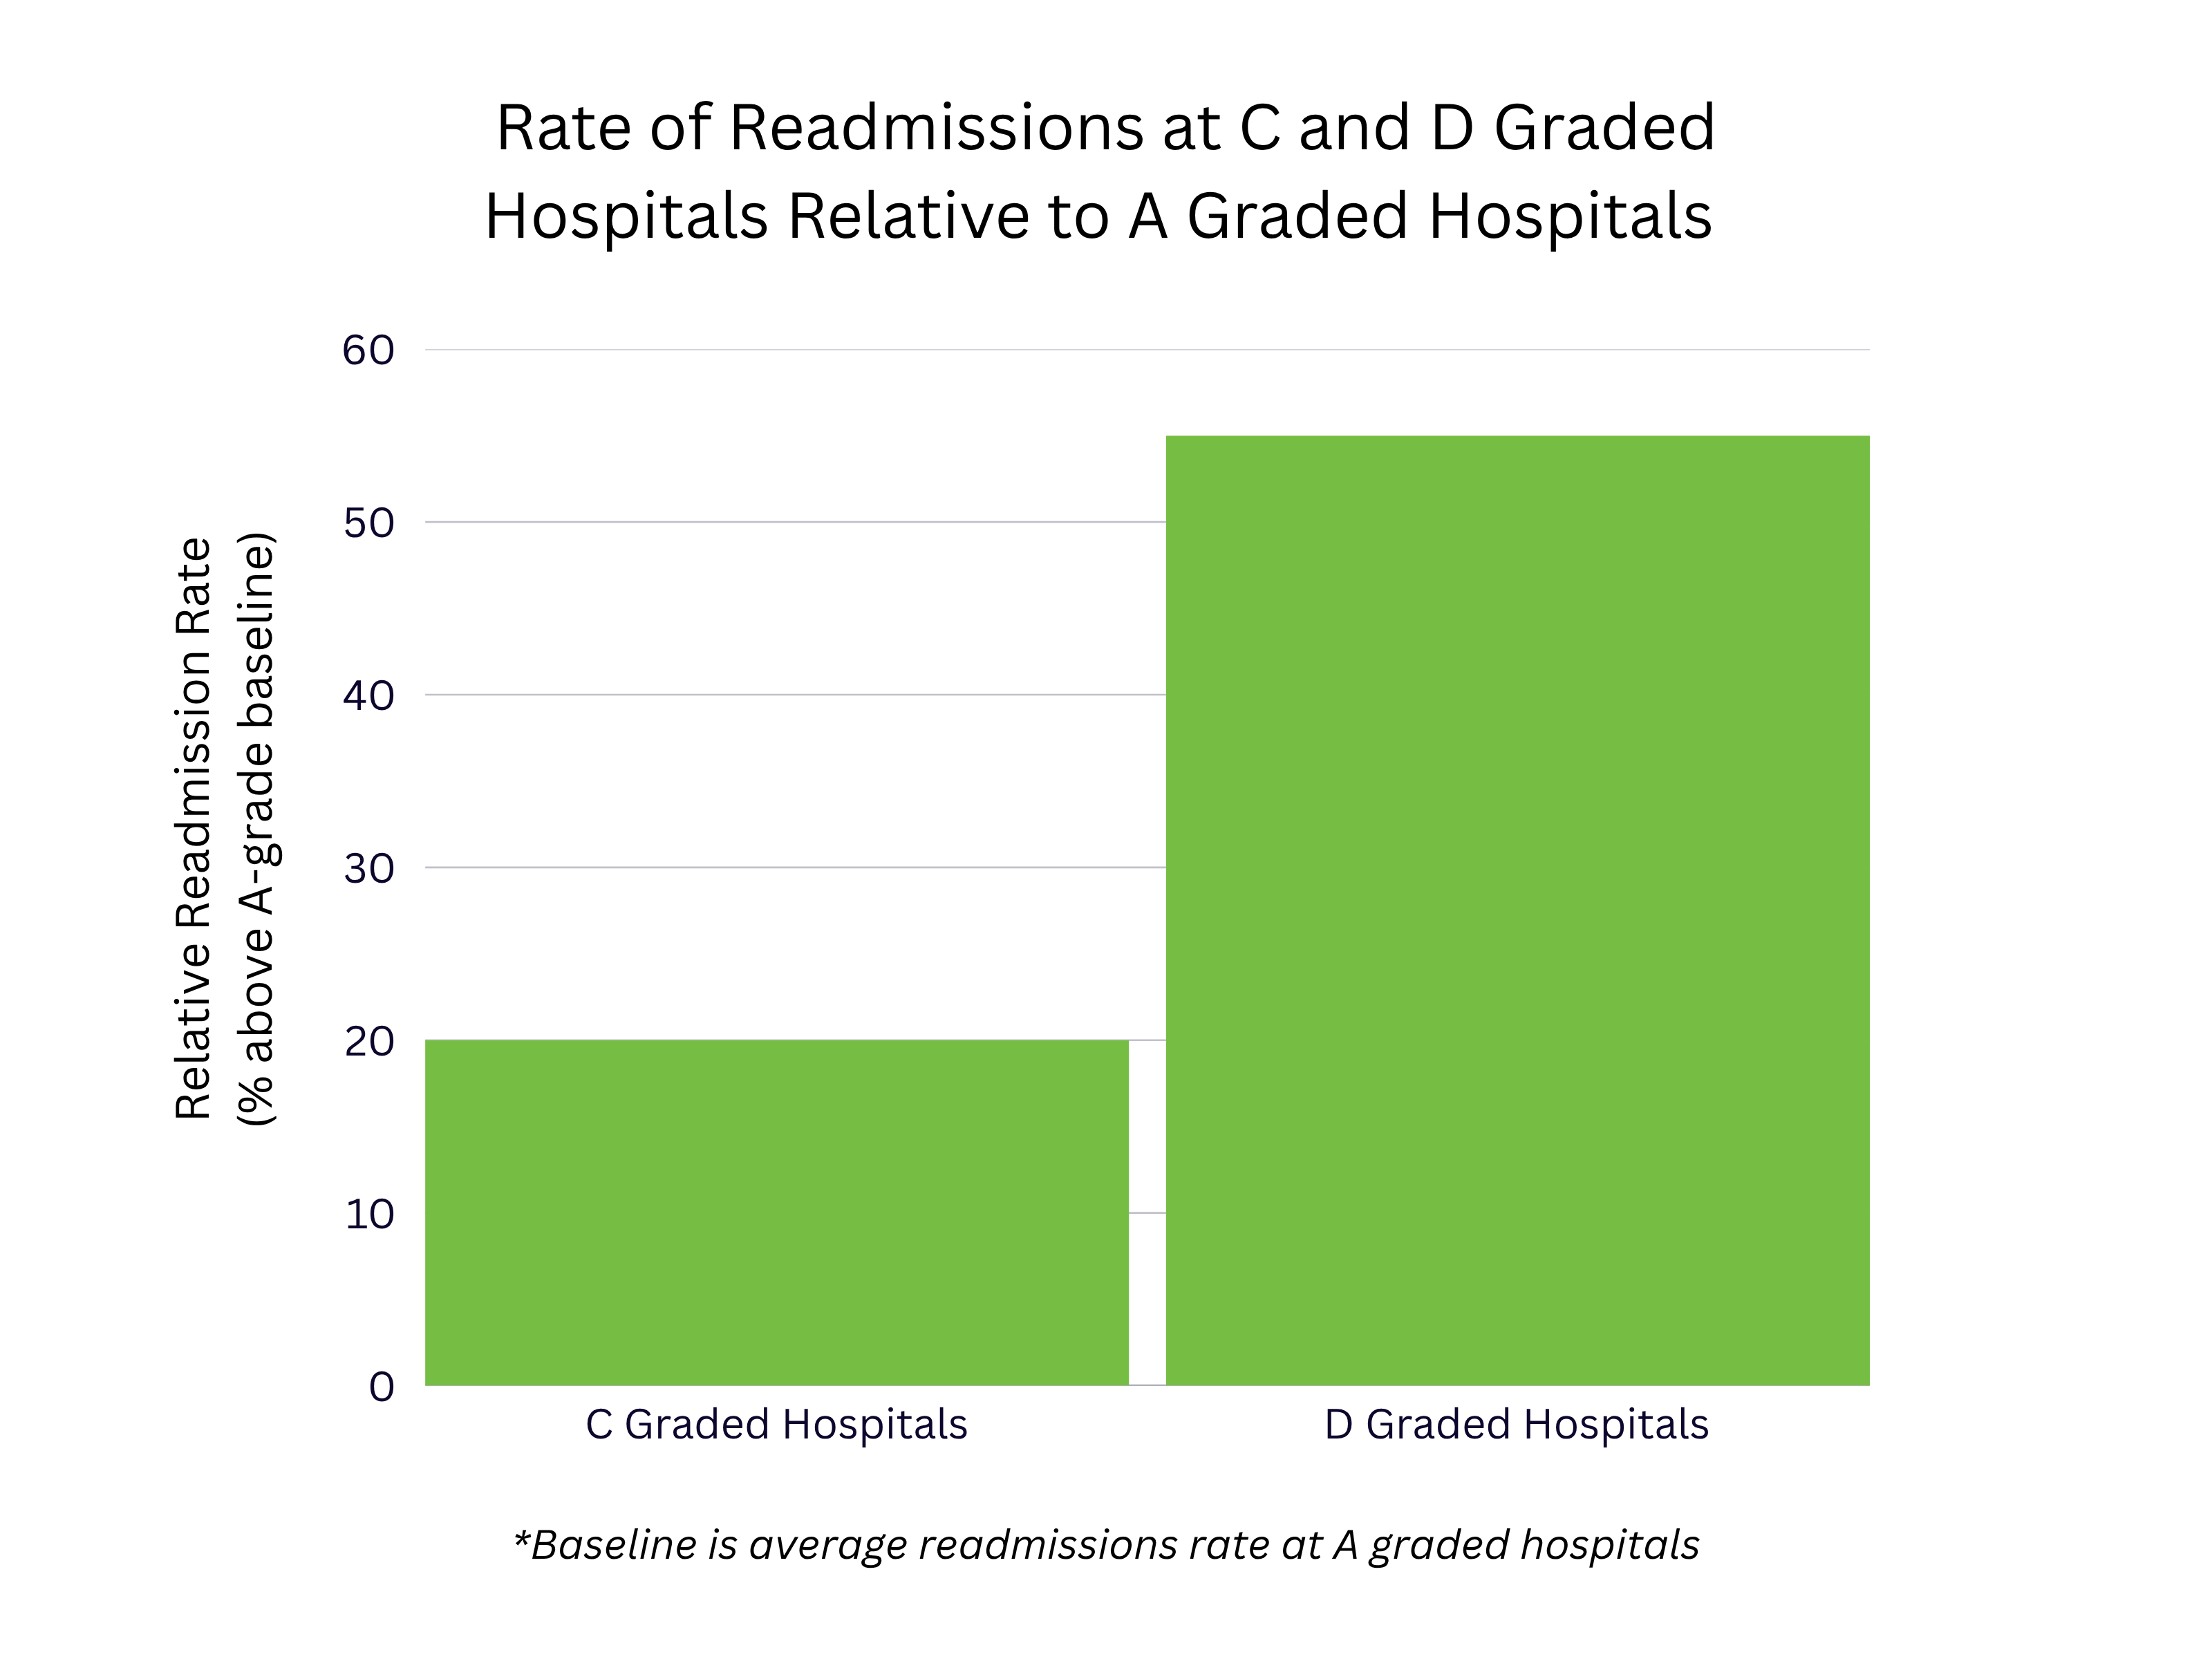
- 55% higher incidence rate of readmissions at D hospitals relative to A hospitals; 20% higher at C hospitals.
- 35% higher average admission cost at D providers relative to A providers.